Graphing is a valuable skill for children to learn and can be introduced as early as late primary years when using our new material, Bar Graph Complete Set! Learning to graph helps children understand data and relationships and can also help them develop their spatial reasoning skills. It does so by showing data using visual representations. Graphs can be used to show how things change over time or to compare different things.
Some children may have a harder time understanding the concept of graphing. Graphing is a concrete skill that is best learned through concrete activities. When children use hands-on materials to graph, they can see and feel the relationships between the data points. This helps them to develop a deeper understanding of how graphs work.
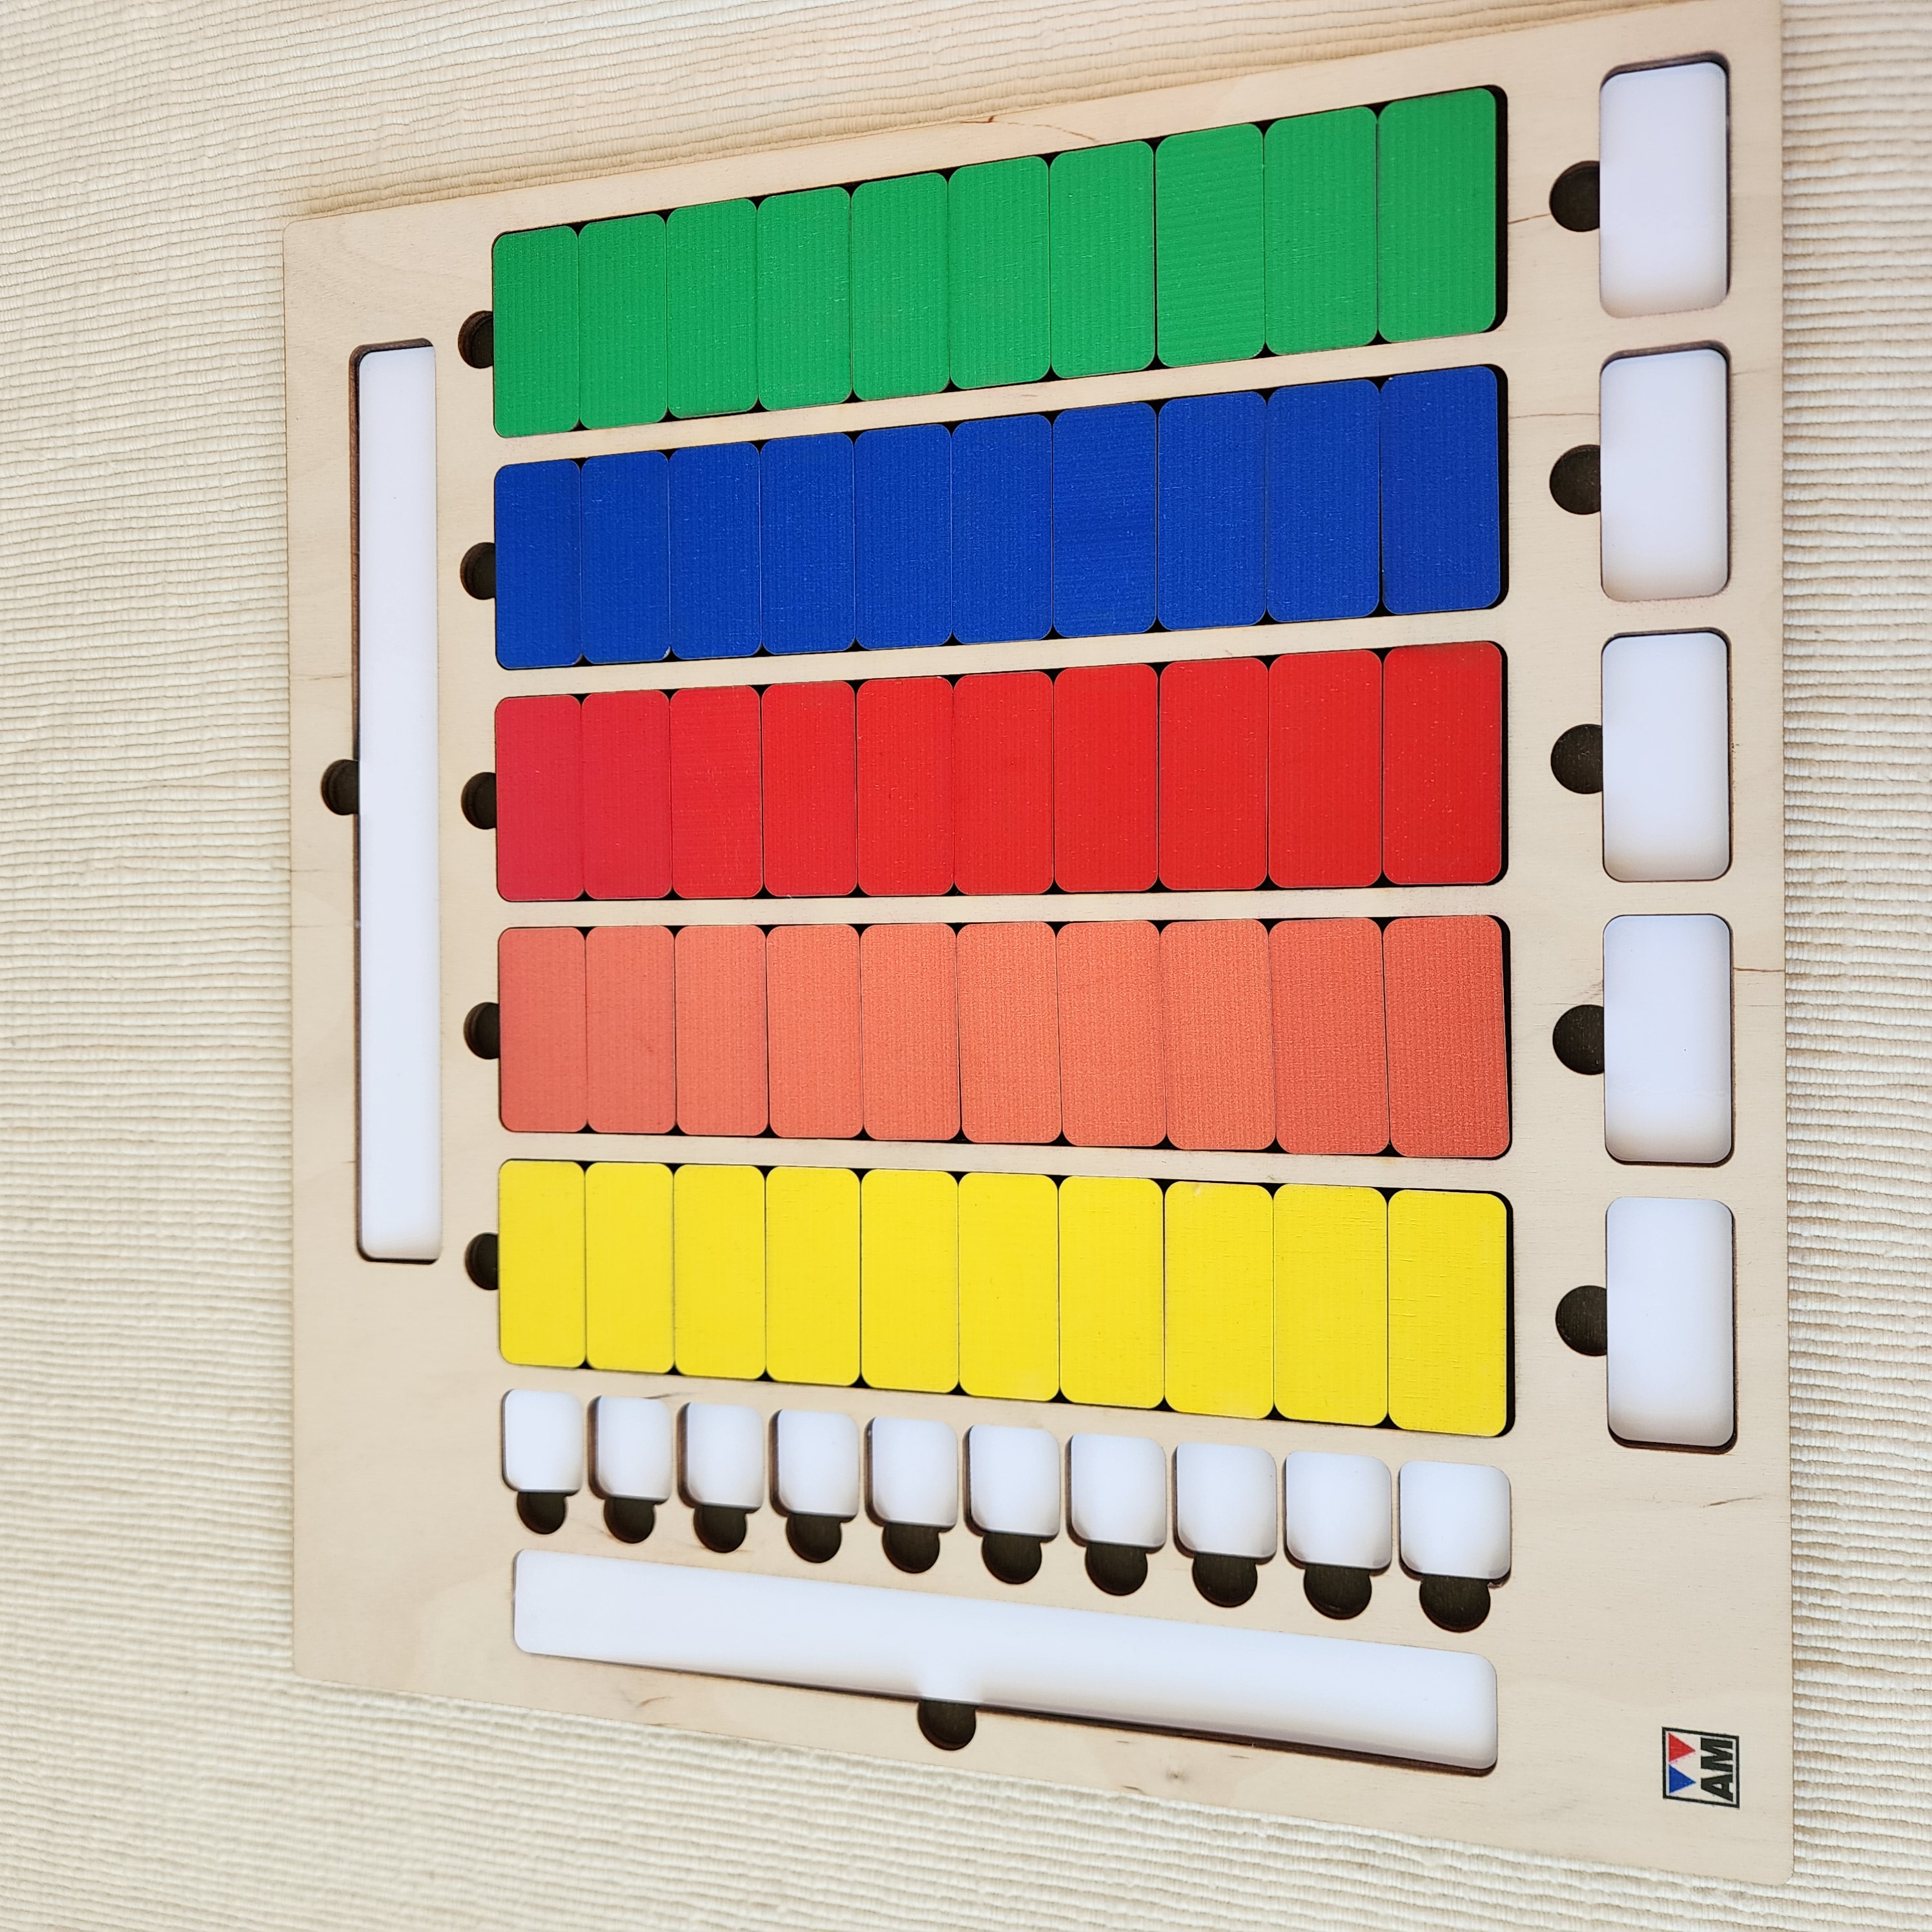
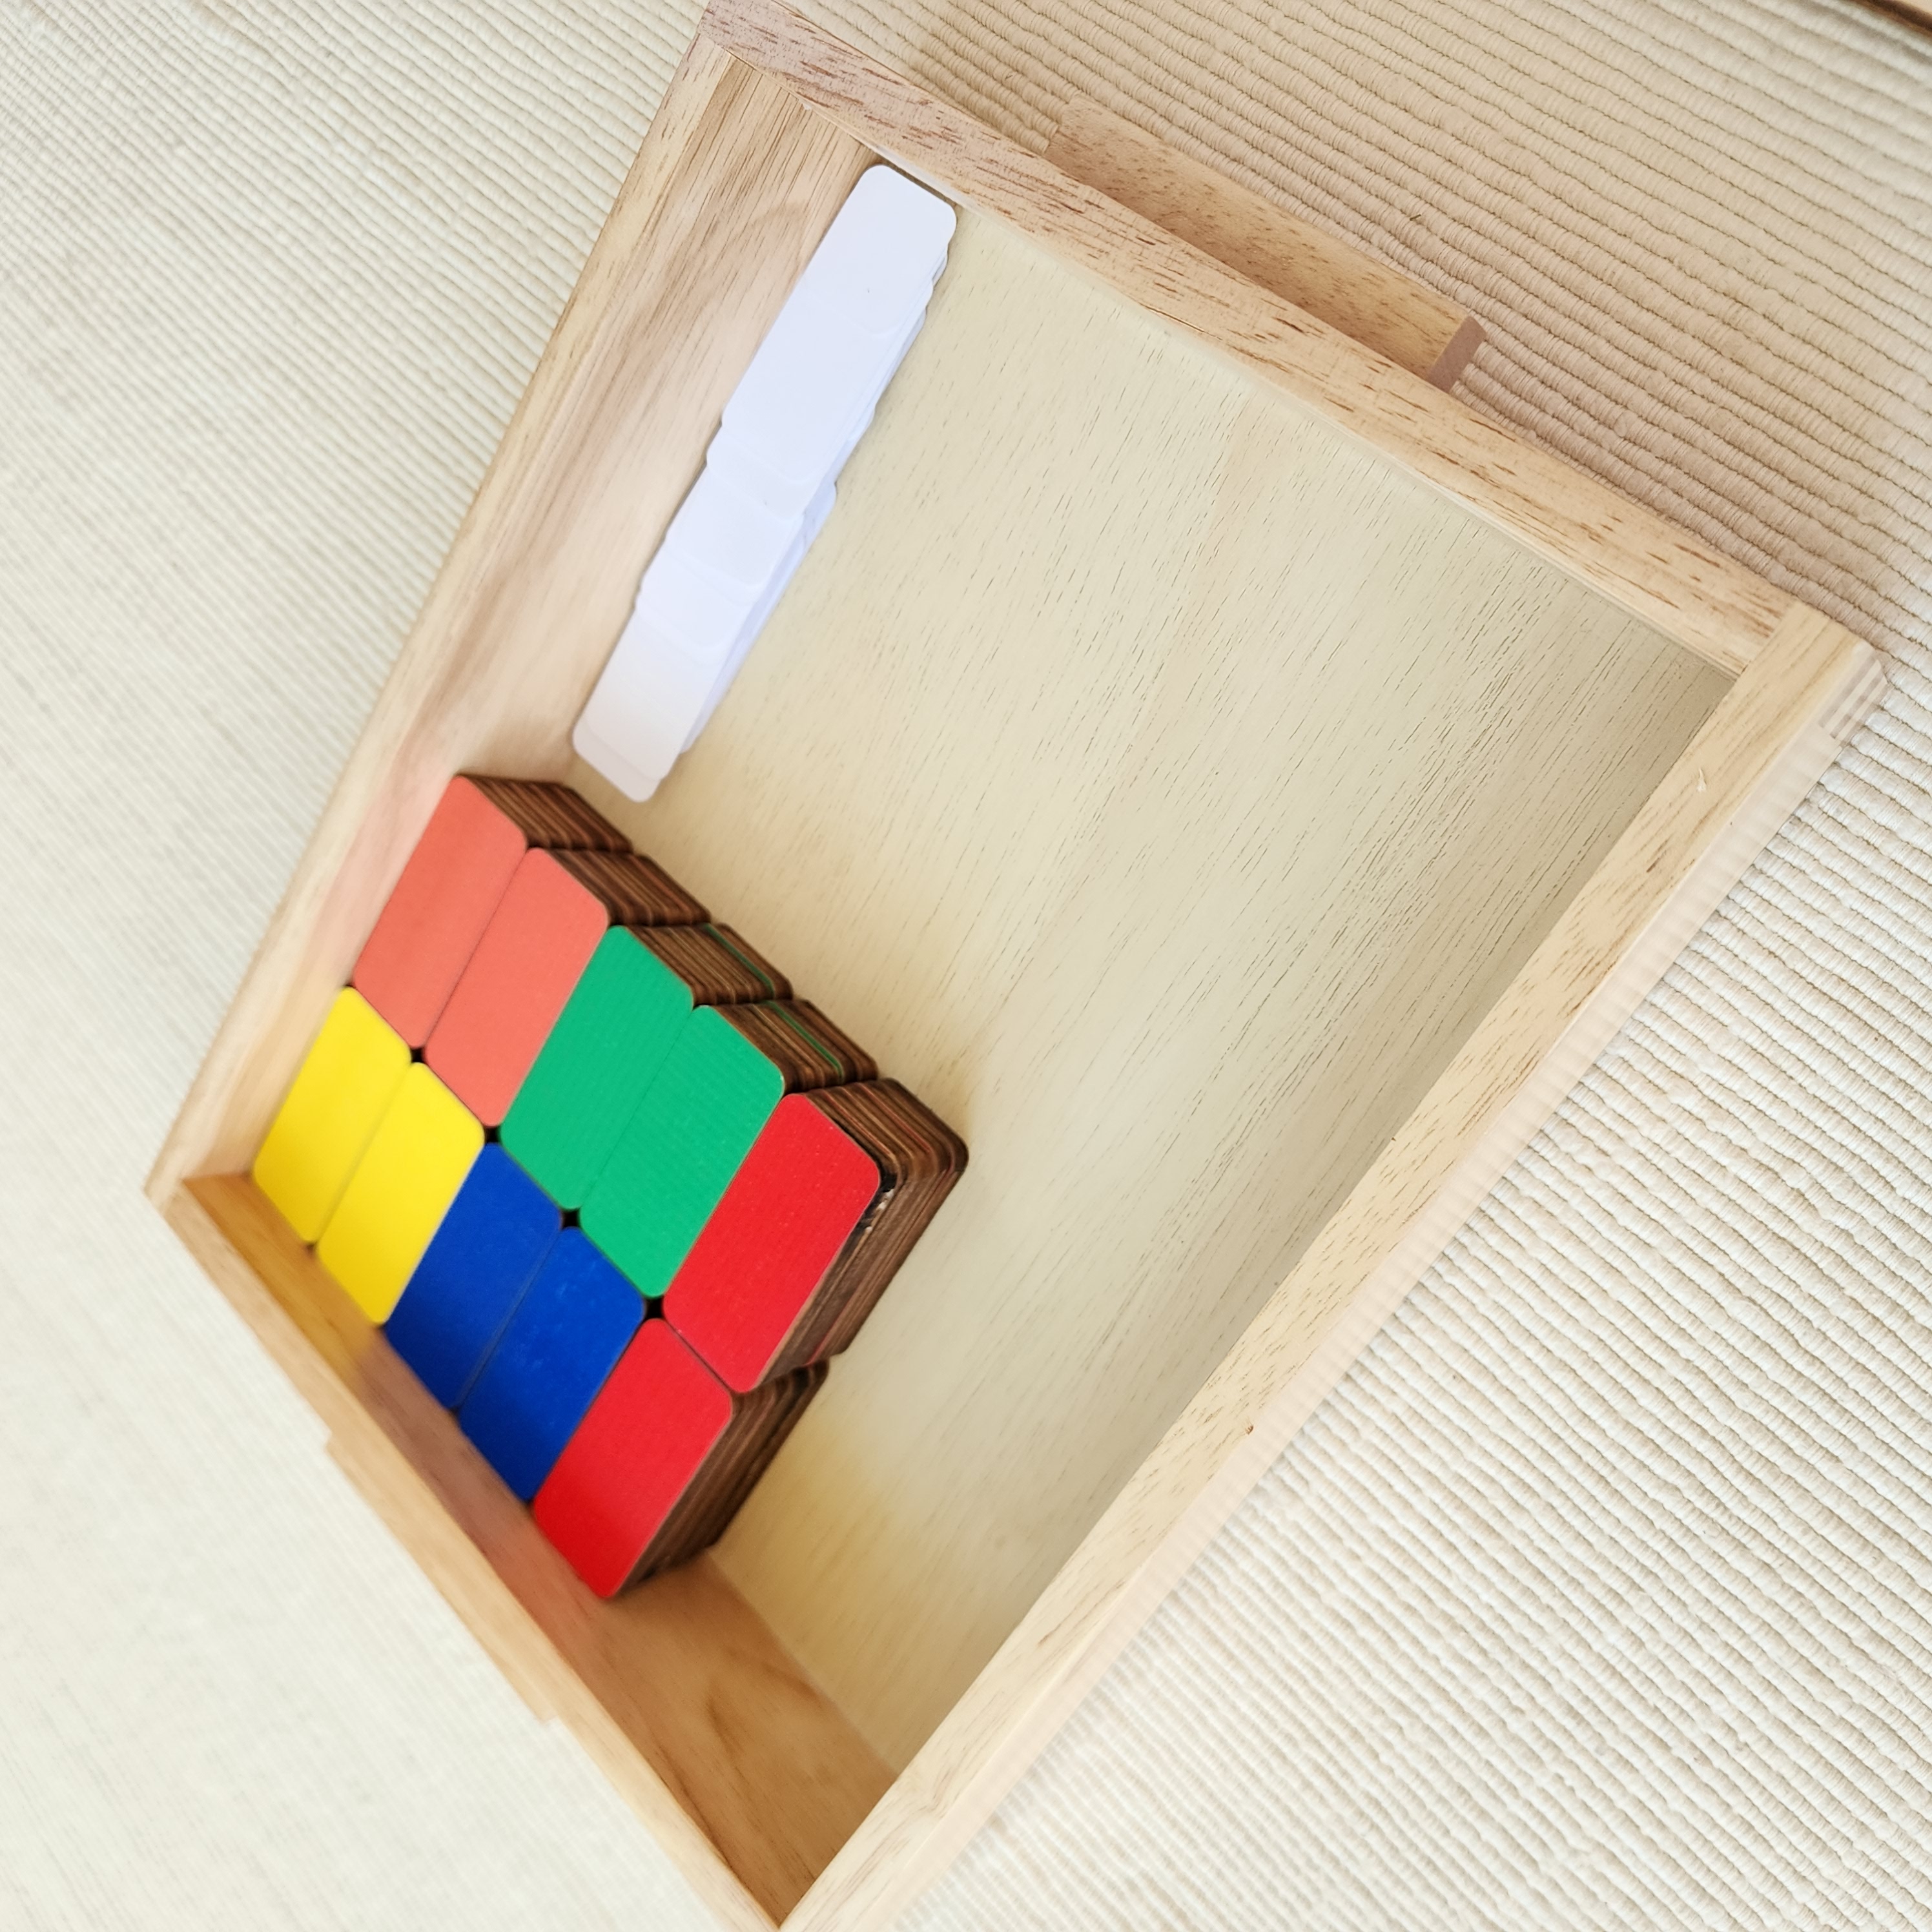
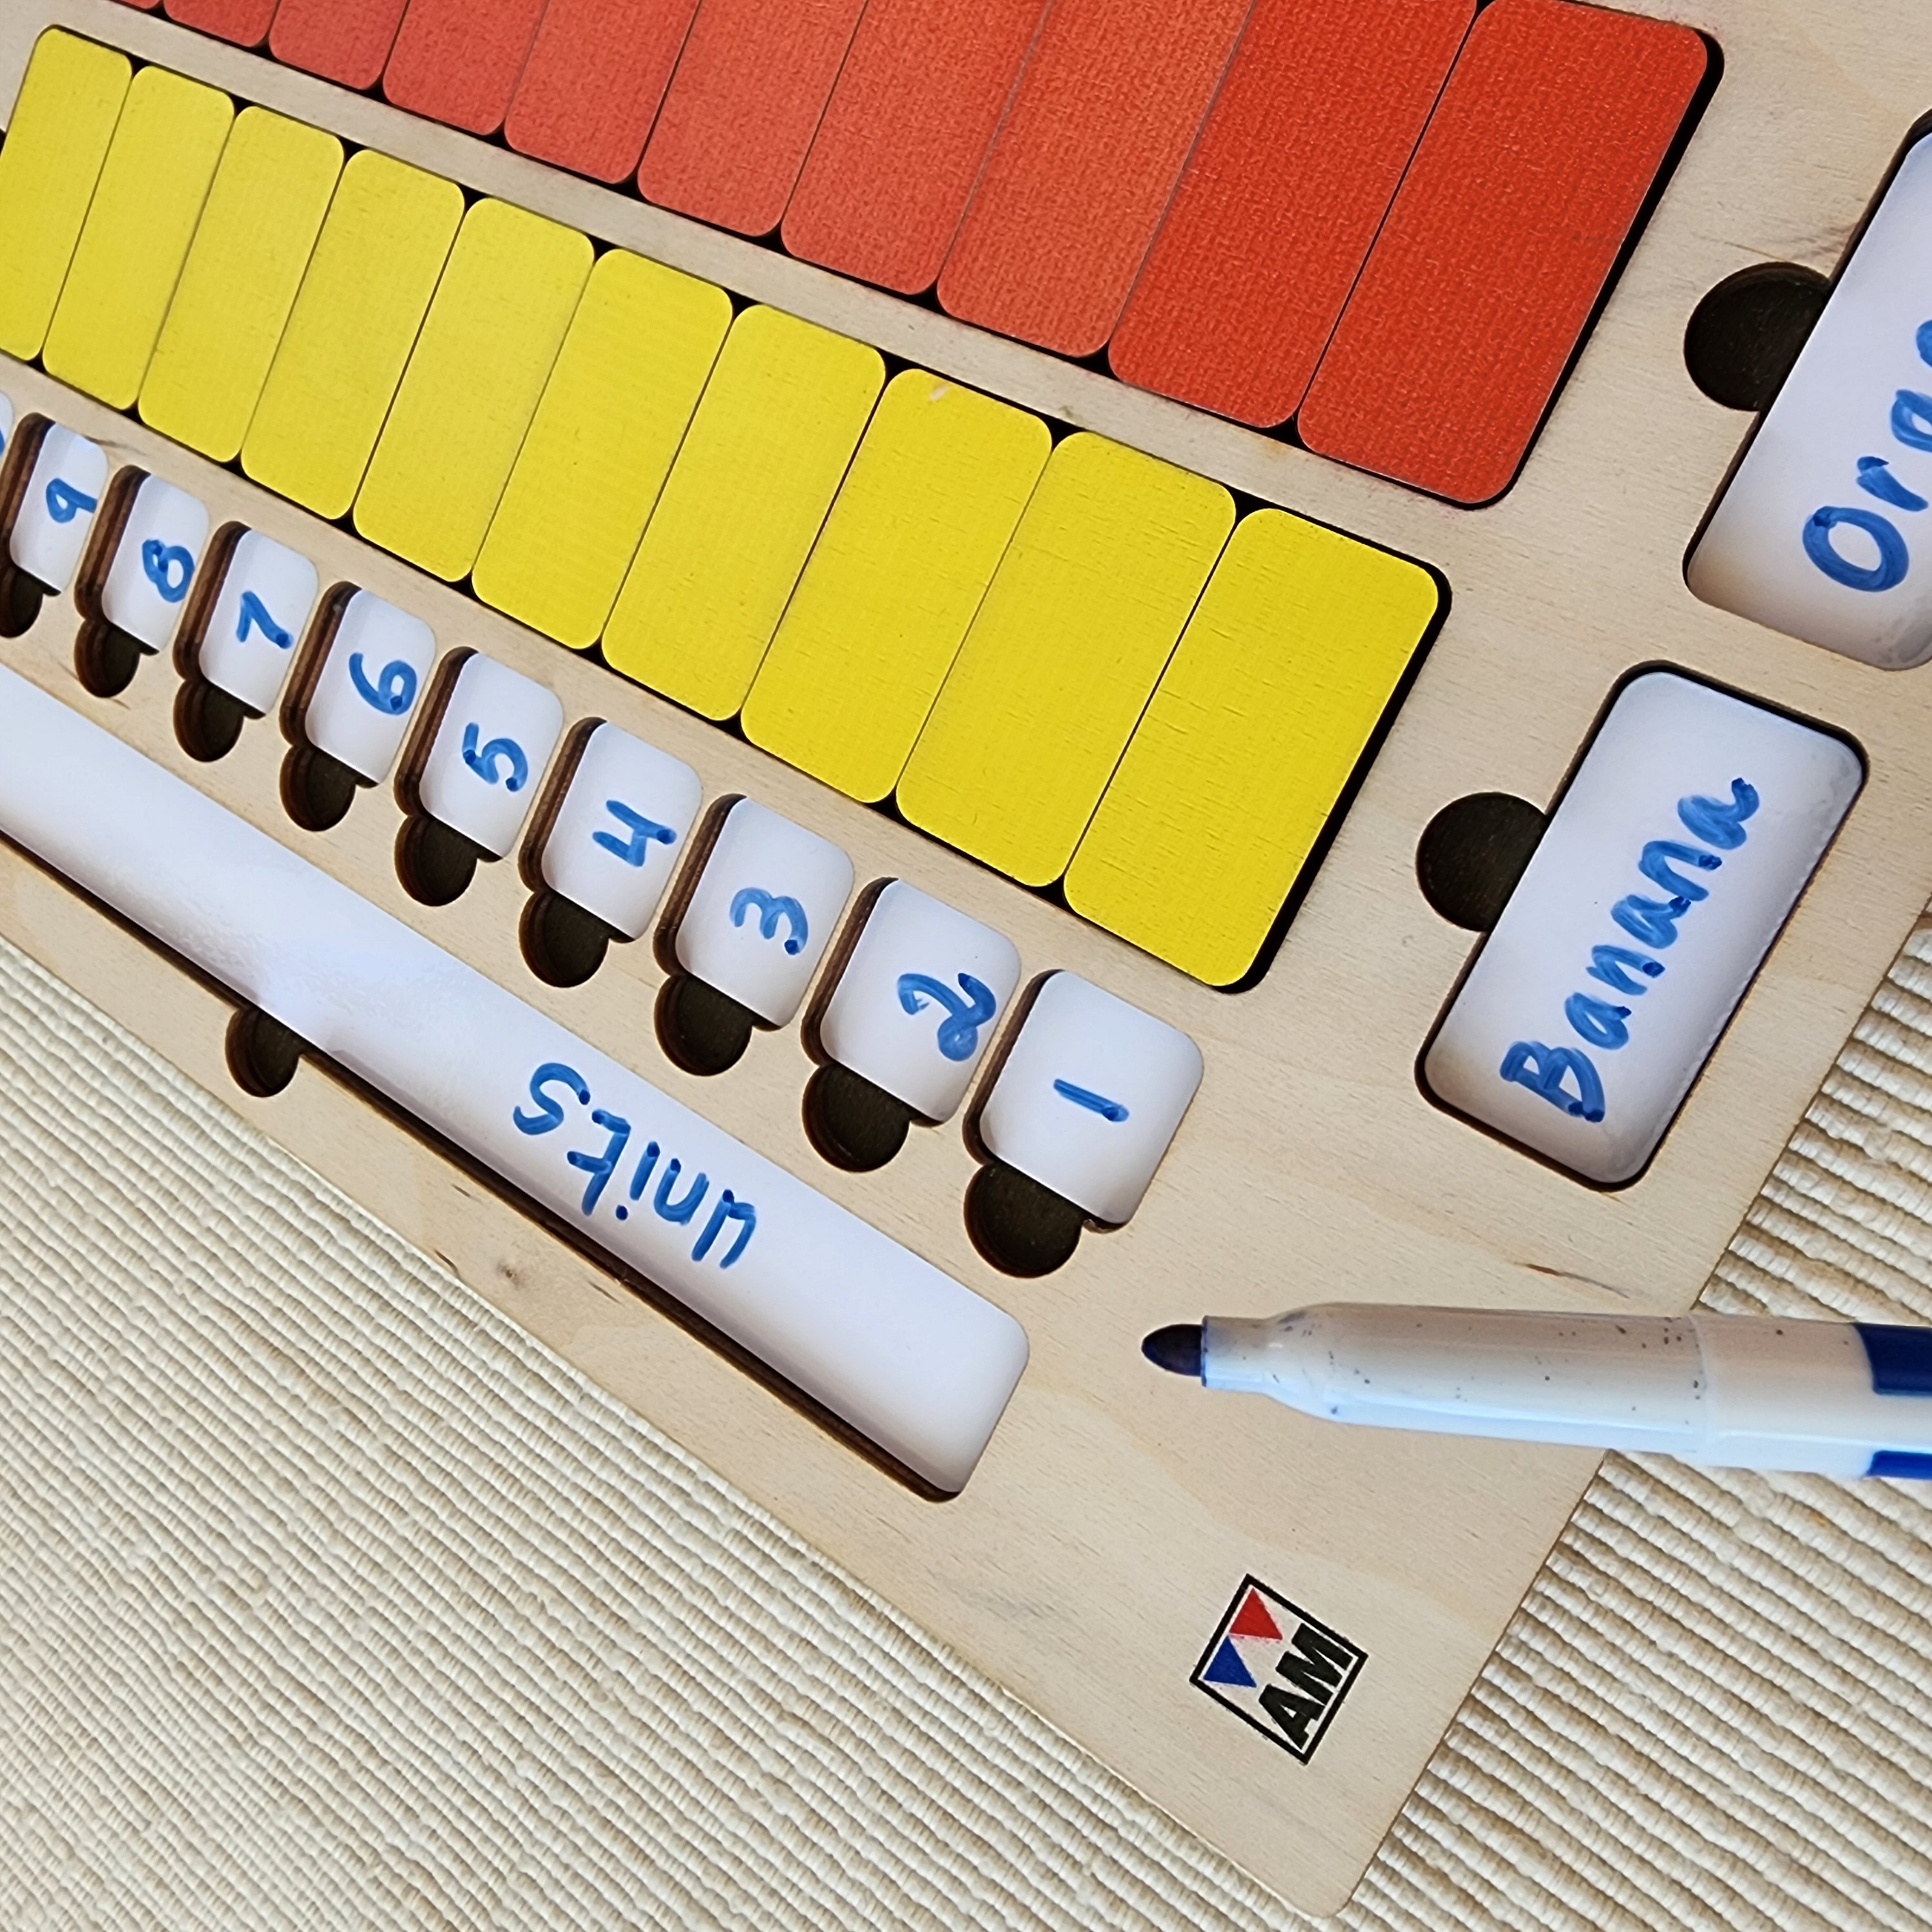
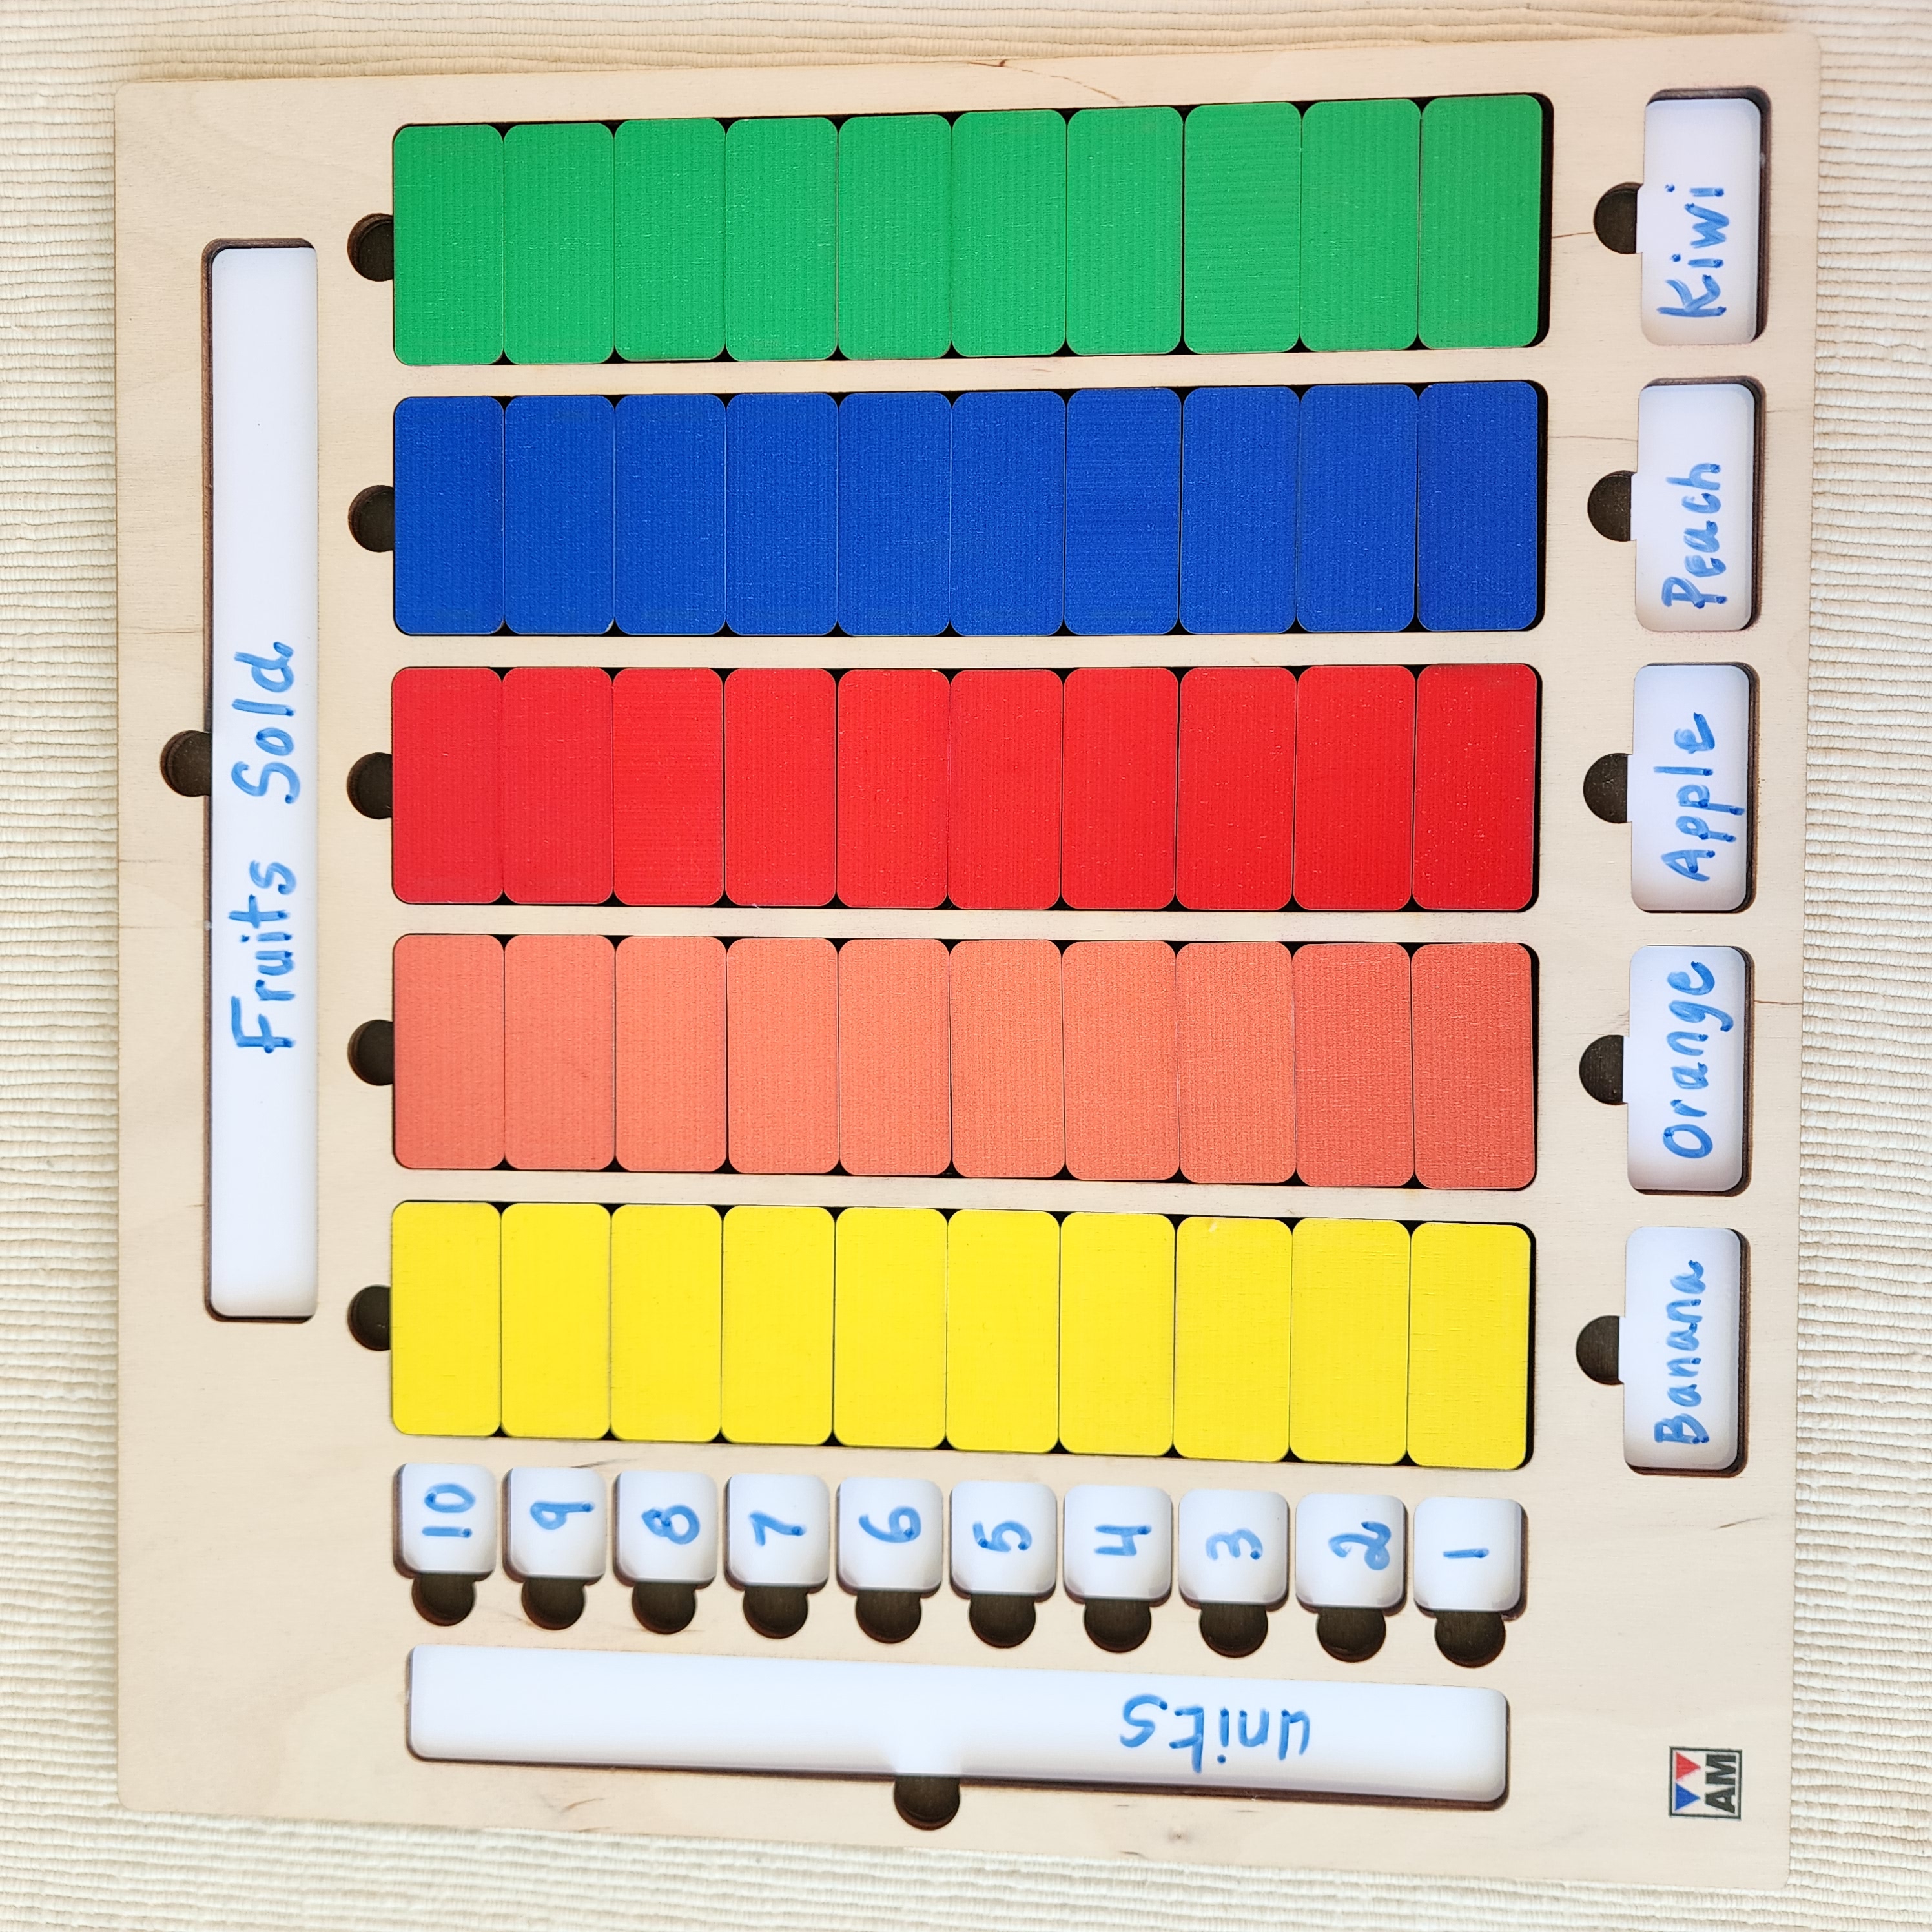
Although our material, Bar Graph Complete Set, is labeled as elementary level, we believe children as young as five can start learning about graphing data using the board with tiles. At this age, learning to graph with concrete activities can be an unconscious experience through a fun combination of wooden tiles, reinforcing the one-on-one correspondence work. For example, you may offer a set of various fruits and ask children to place one red wooden tile in the red-labeled column for every apple present in the set, one yellow wooden tile in the yellow-labeled column for every banana, and so on. This is enough for children to have prior experience with graphing without mentioning any technical words.
As children get older, they learn to use more abstract materials, such as graph paper and markers, to create graphs. In elementary school, children are typically taught how to create and interpret bar graphs, line graphs, and pie charts. But before this, concrete materials such as our Bar Graph offer a more natural and memorable way to learn and practice the skill of plotting data in visual representations.
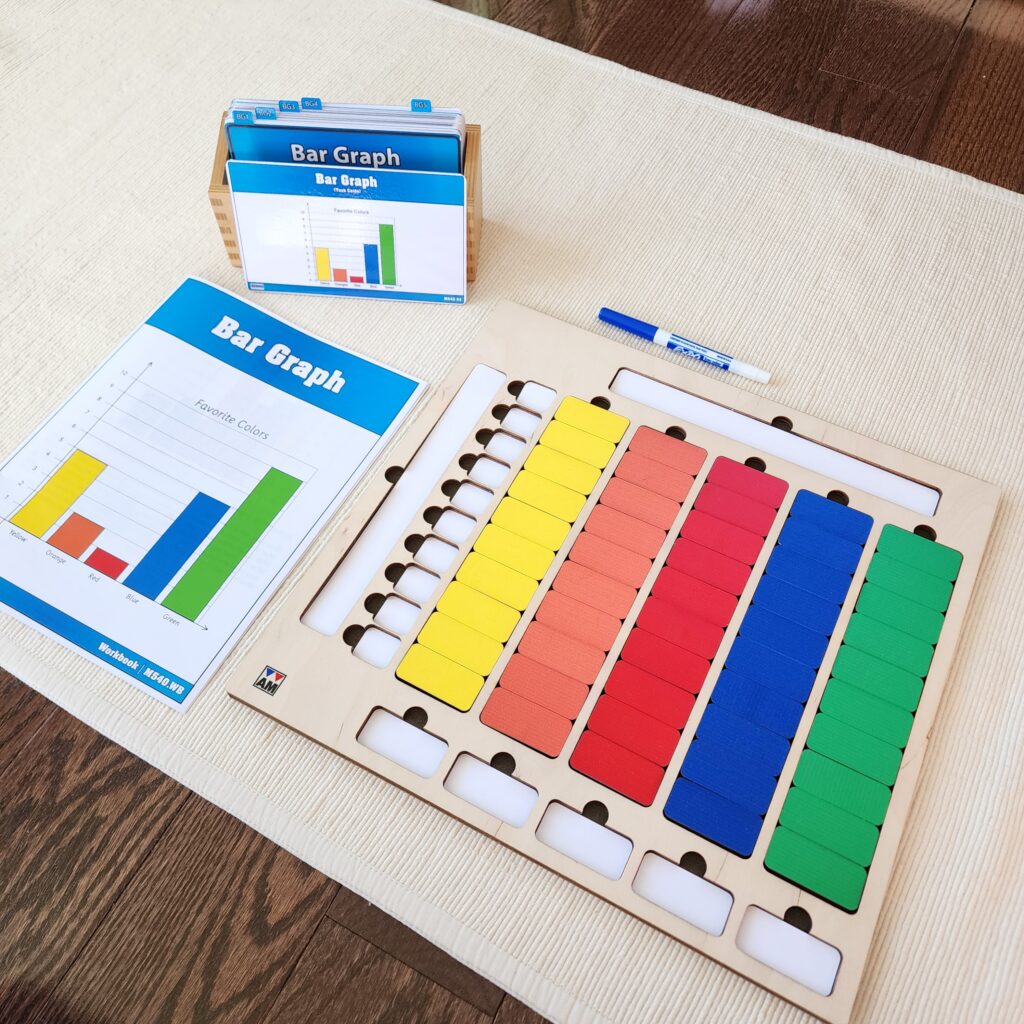
With our new material, Bar Graph is adaptable to any topic you wish to explore. It consists of a large wooden board that hosts wooden and printed labels, 46 task cards, and a reproducible workbook. Using a dry-erase marker, you can demonstrate how to represent data in a bar graph fashion.
Materials
Bar Graph Task Cards
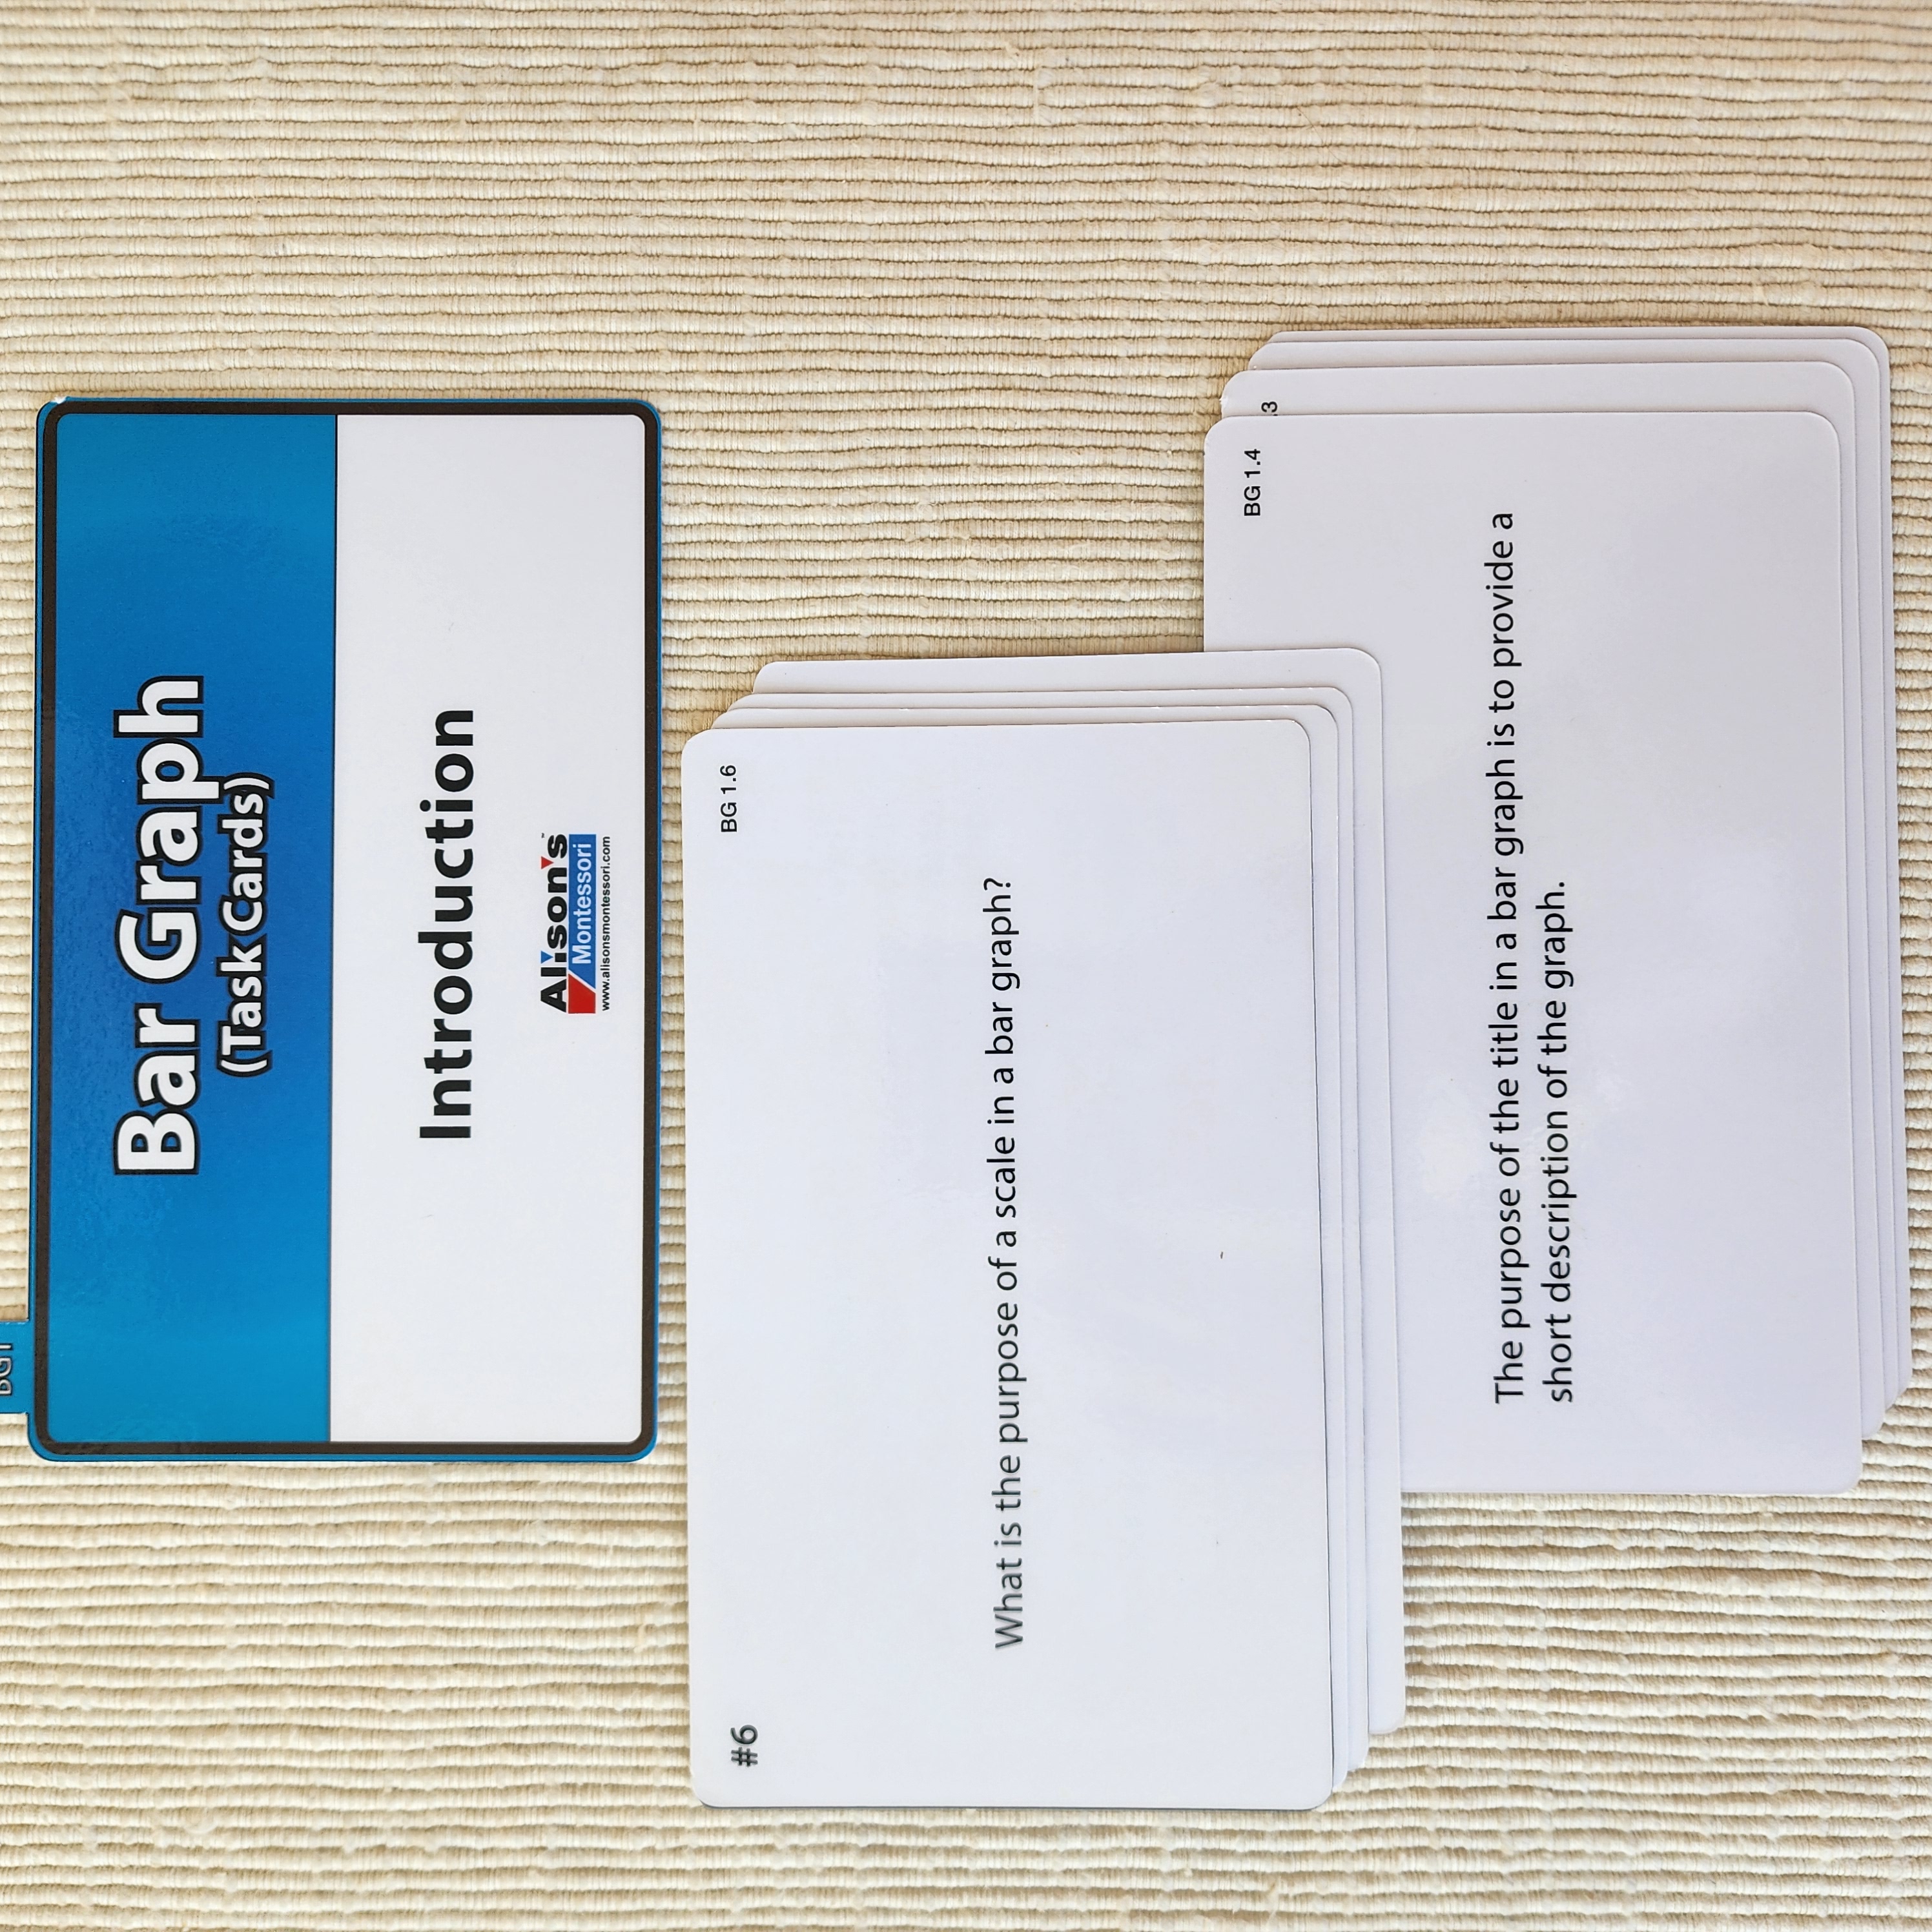
Section BG1 consists of eight cards helping children to learn about the parts and purposes of a bar graph: title, labels, scale, bars, etc. An answer is provided on the back of the cards: “The purpose of the title in a bar graph is to provide a short description of the graph.”
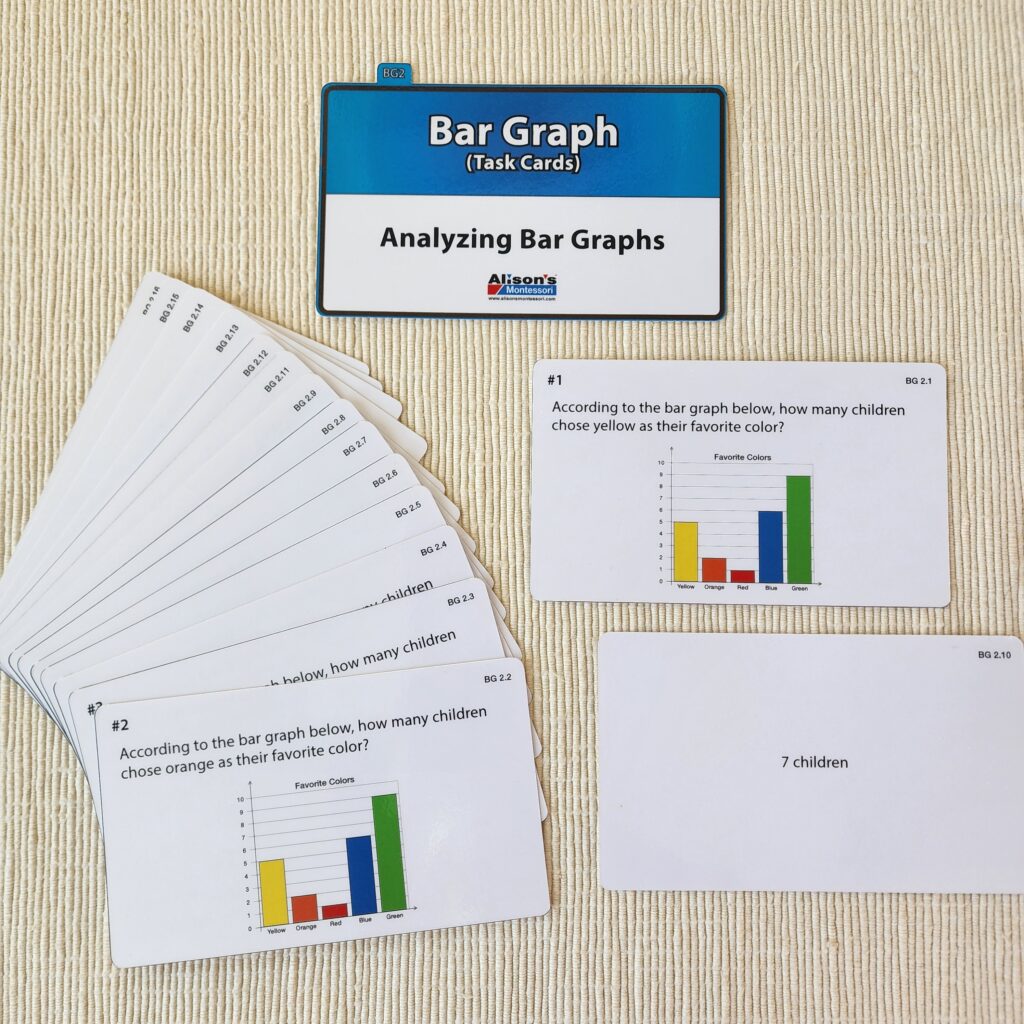
Section BG2 consists of 16 cards that contain 2 different bar graphs. Children go through questions challenging their observation and analytic skills: “According to the bar graph below, how many children chose yellow as their favorite color?”
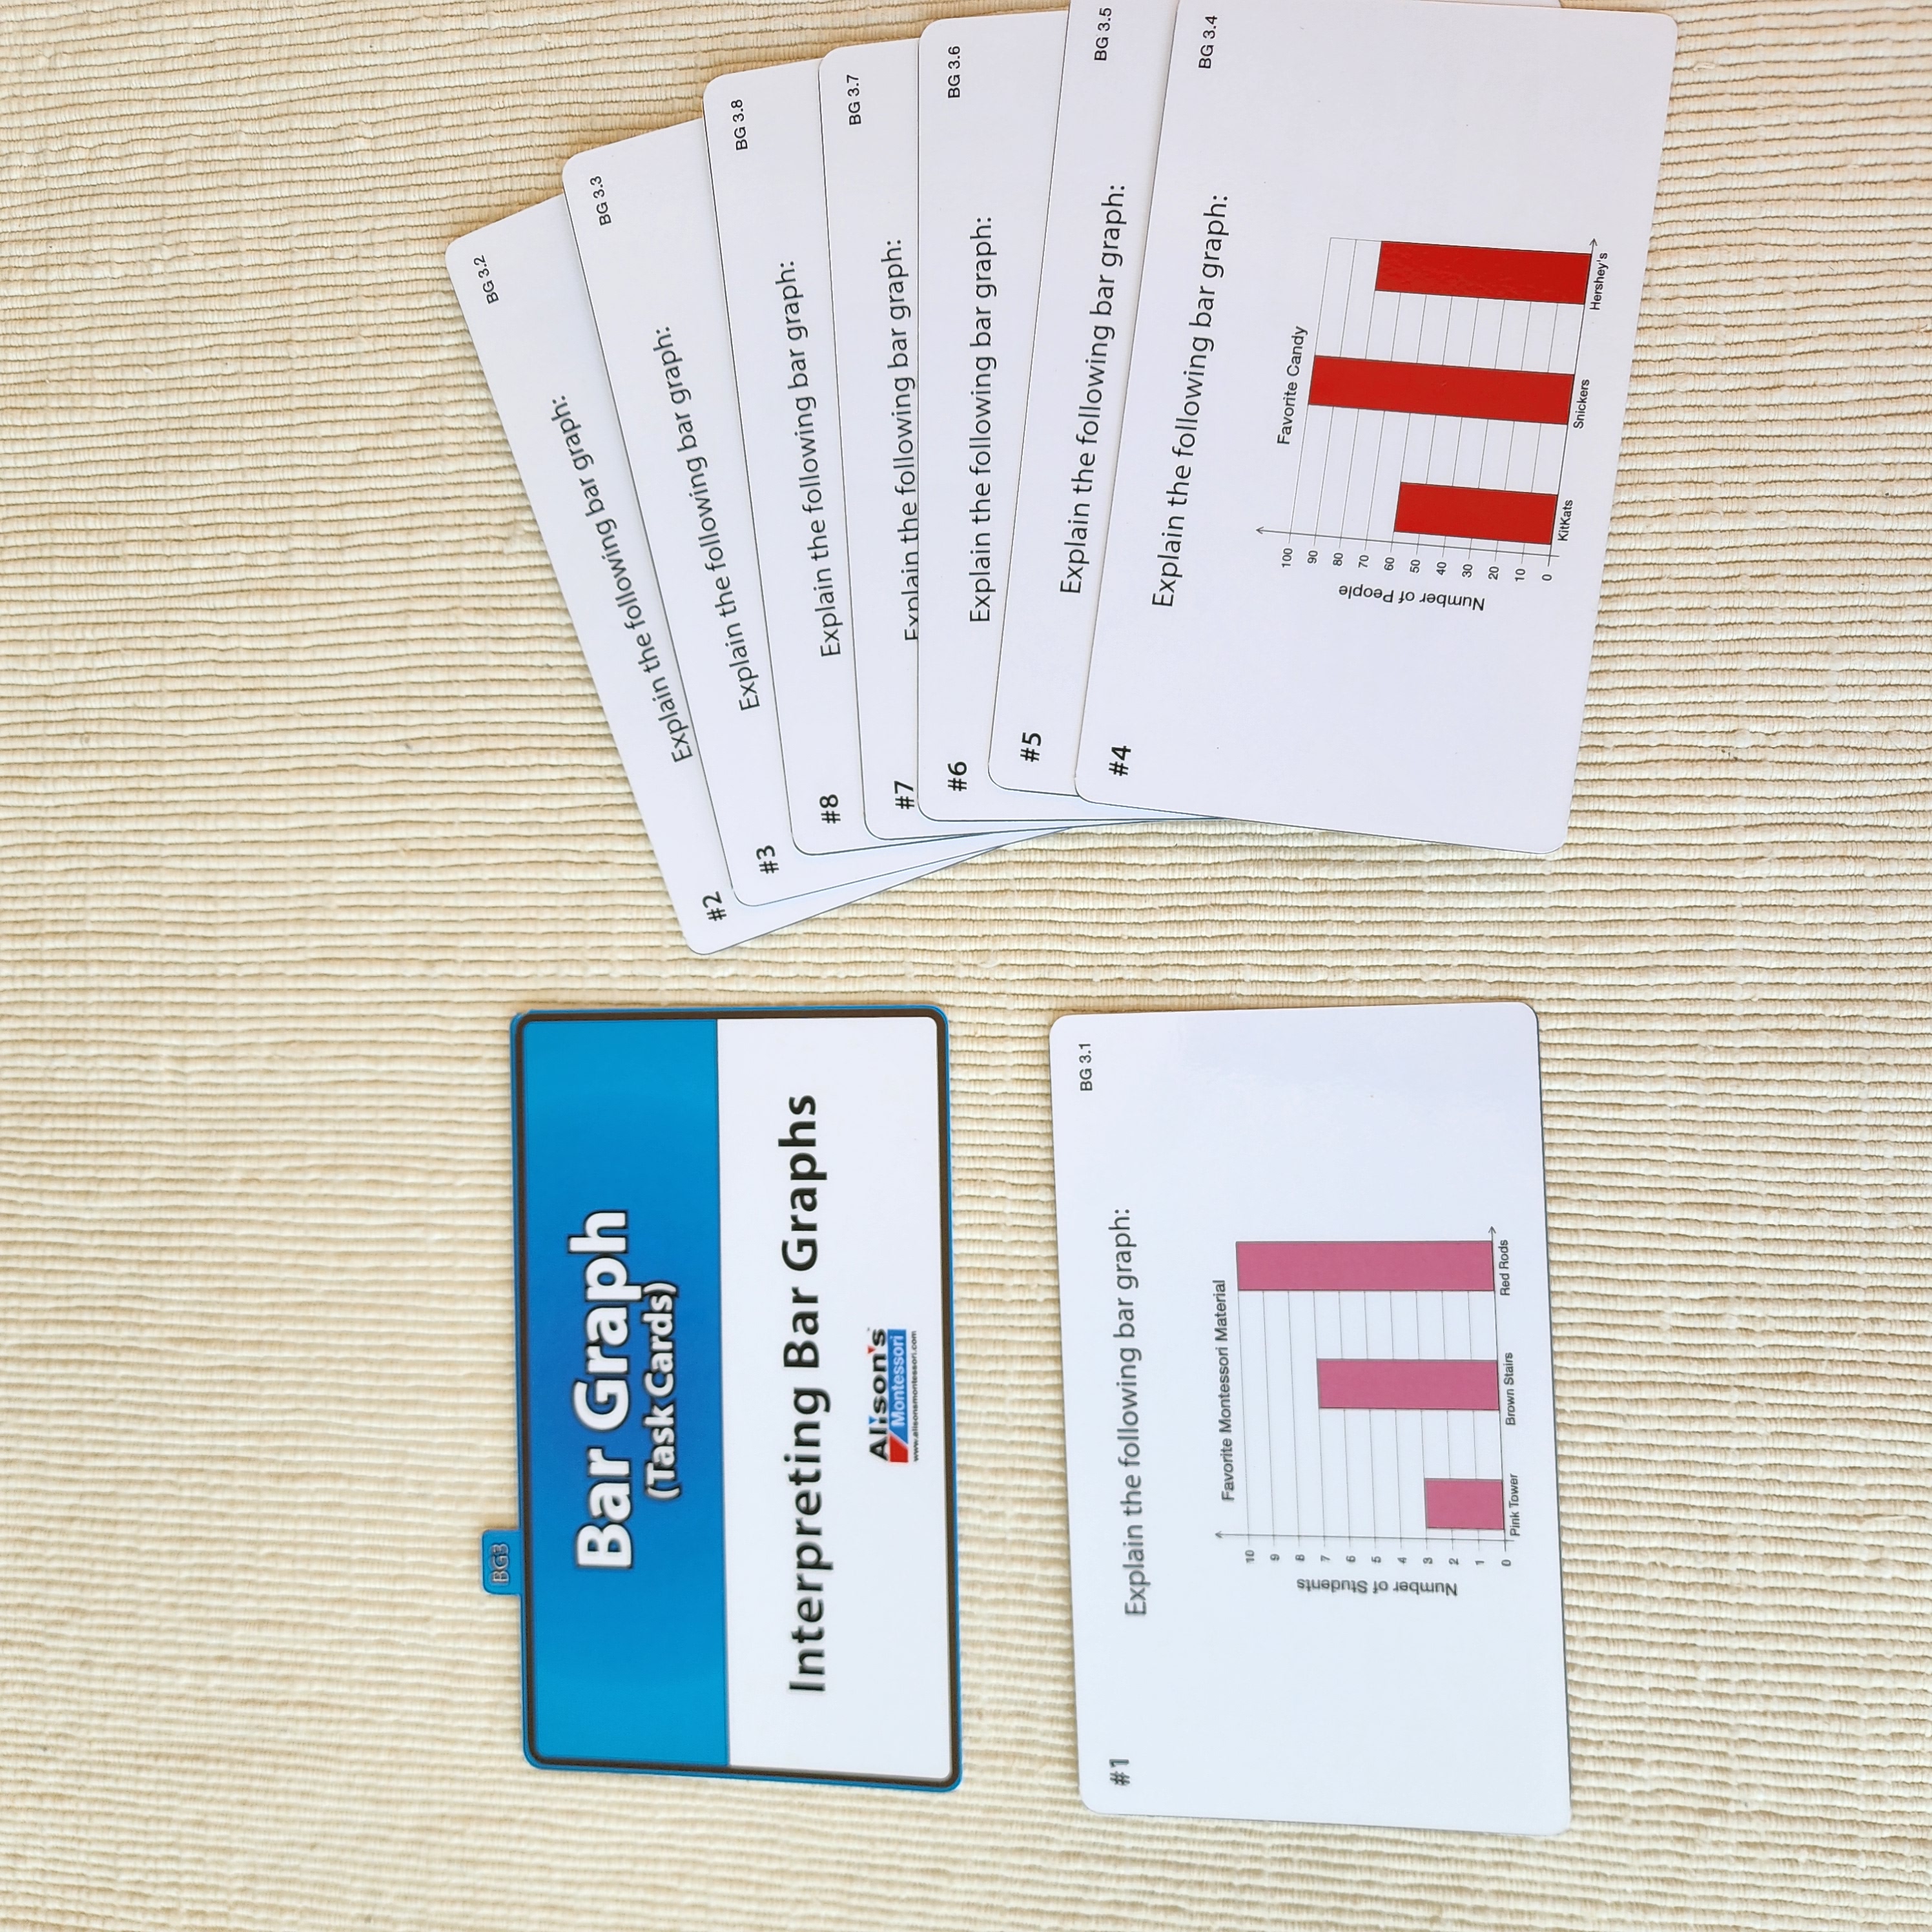
Section BG3 consists of eight cards with eight different graphs. For each graph, children must thoroughly describe the bar graph: “Explain the following bar graph.” A model is provided on the back, “The bar graph represents favorite Montessori materials among students. The Montessori materials included in the graph are…”
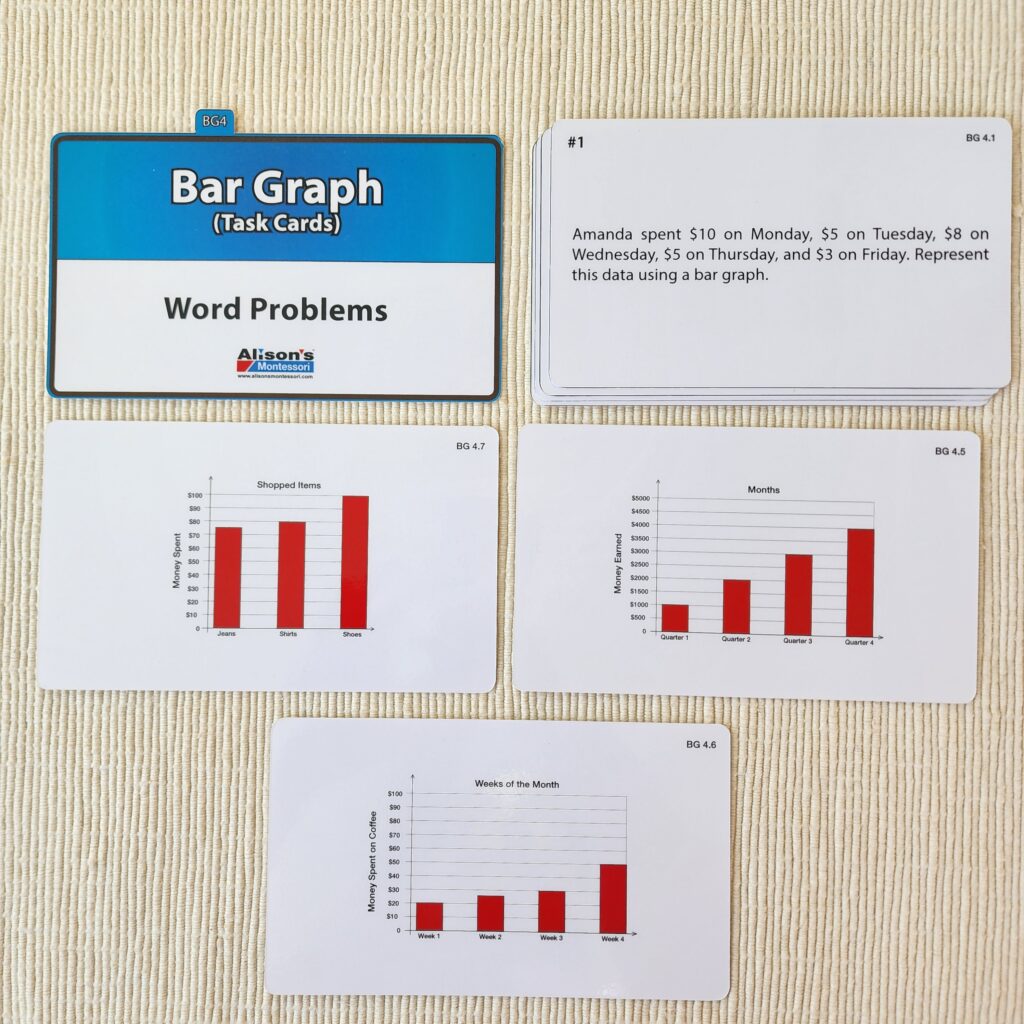
Section BG4 consists of seven cards in which children are provided written data to represent using a bar graph. A visual example is provided on the back of each card. “Alex earned $1,000 in January, $1,200 in February, and $1,500 in March. Represent this data using a bar graph.” Prior work with the Bar Graph board would be perfect!
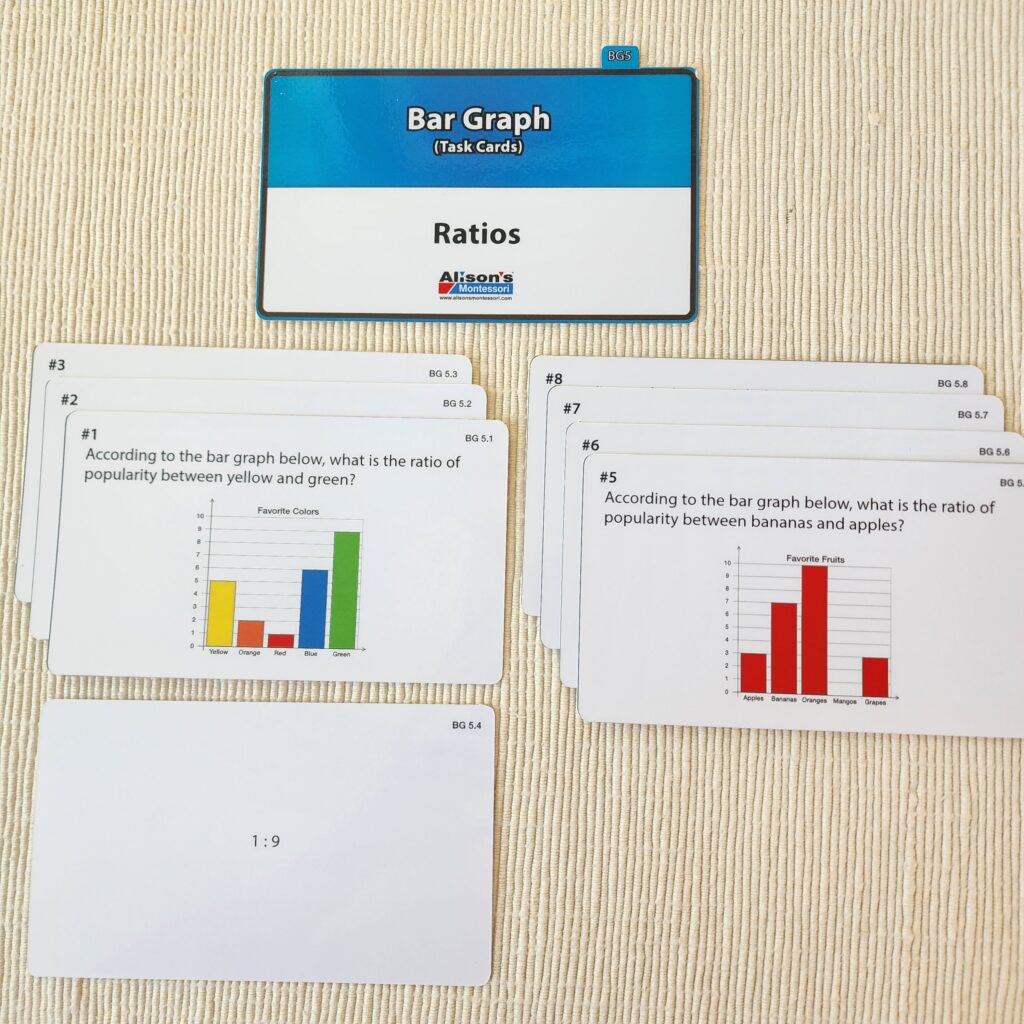
Section BG5 consists of eight cards and is aimed at older elementary learners. This time, children are asked to compare data using ratios. “According to the bar graph below, what is the popularity ratio between red and green?”
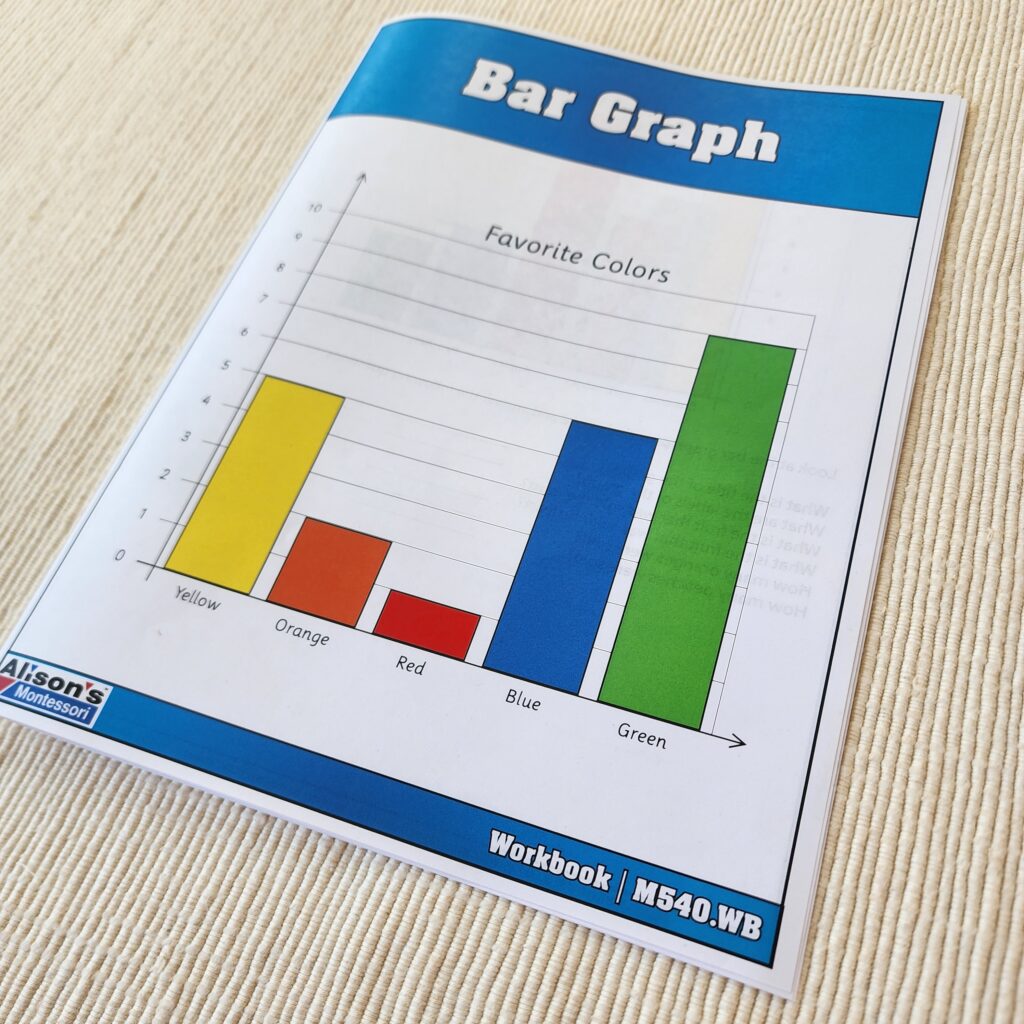
Finally, when children have had enough practice with the Bar Graph wooden board and the Bar Graph Task cards, they may use a copy of the reproducible workbook included in the task cards set. This extension provides additional hands-on work and cognitive reasoning tasks, which should lay a strong foundation for working with other forms of visual data representation, such as line graphs and pie charts!
For more hands-on, innovative learning materials, visit our website at www.alisonsmontessori.com